
![30 Must-Know Text Marketing Statistics [Infographic] - 2023 Update](https://blog.textedly.com/hubfs/30%20Must-Know%20Text%20Marketing%20Statistics%20%5BInfographic%5D%20-%202023%20Update.jpg)

Business texting stats show that SMS texting is one of the most effective marketing channels available today, contributing to its growing popularity.
Did you know the average person spends almost 7 hours a day looking at a screen – a majority of which (3 hours and 43 minutes) is spent on their mobile phone? With over 91% of the global population owning a smartphone, these statistics indicate the enormous potential of text messaging as a business communication channel in marketing campaigns today.
The following text marketing statistics speak for themselves. If you’re considering using text messaging for your business, here are the most compelling facts about texting in 2023.
Mobile Usage Statistics
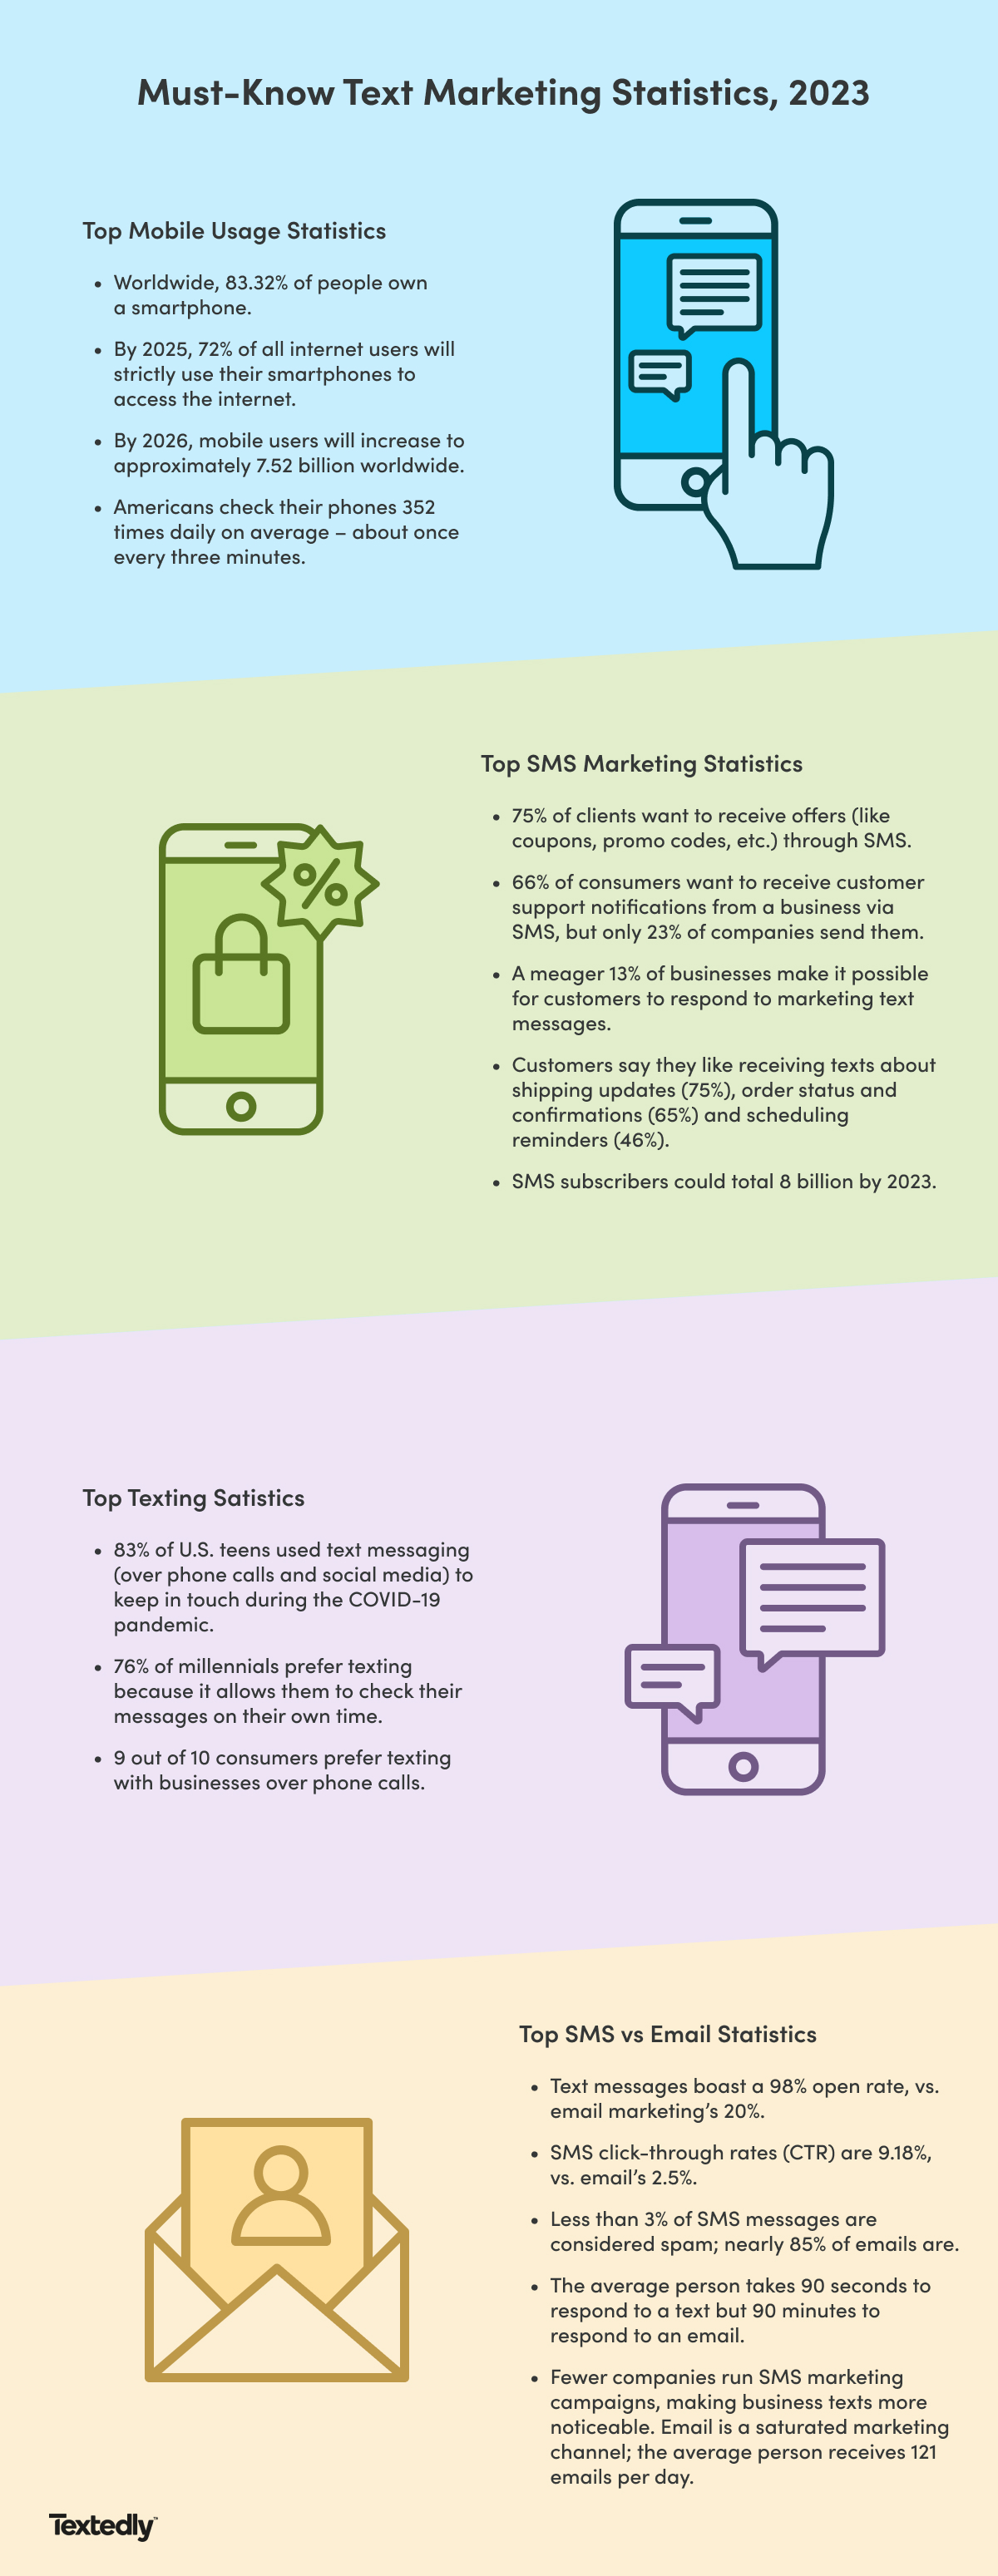
- Worldwide, 83.32% of people own a smartphone. [1]
- It is forecasted that, by 2025, 72% of all internet users will strictly use their smartphones to access the internet. [1]
- By 2026, mobile users will increase to approximately 7.52 billion worldwide. [1]
- 81.60% of the United States population owns a smartphone – about 270 million people! [1]
- The average American spends 3 hours and 30 minutes of their day looking at their mobile phone. [2]
- Americans check their phones 352 times daily on average – about once every three minutes. [17]
- 75.4% of Americans consider themselves addicted to their phones. [3]
Top SMS Marketing Statistics
- 75% of clients want to receive offers (like coupons, promo codes, etc.) through SMS. [5]
- 66% of consumers want to receive customer support notifications from a business via SMS, but only 23% of companies send them. [6]
- A meager 13% of businesses make it possible for customers to respond to marketing text messages. [6]
- Customers say they like receiving texts about shipping updates (75%), order status and confirmations (65%) and scheduling reminders (46%). [6]
- SMS databases grow an average of 41% during the holidays. [6]
- SMS subscribers could total 8 billion by 2023. [5]
Mobile Commerce Statistics
- Sales generated from mobile commerce are expected to reach about $432 billion in 2022. [7]
- By 2025, retail m-commerce is expected to reach $728 billion, accounting for 44.2% of U.S. retail ecommerce sales. [15]
- 8% of all retail transactions are expected to occur via mobile device in 2023. [15]
- U.S. mobile commerce will nearly double between 2020 and 2025. [16]
- 80% of B2B buyers use mobile devices to purchase products online. [9]
- 90% of consumers report that an excellent mobile experience will likely prompt a repeat purchase. [9]
- Globally, mobile commerce makes up 67.2% of all e-commerce sales. [10]
- The mobile coupon industry is expected to grow 56.5% by 2025. [10]
- 75% of customers complete purchases on their mobile phones. [10]
Texting Statistics
- 83% of U.S. teens used text messaging (over phone calls and social media) to keep in touch during the COVID-19 pandemic. [11]
- 76% of millennials prefer texting because it allows them to check their messages on their own time. [12]
- 9 out of 10 consumers prefer texting with businesses over phone calls. [13]
SMS Marketing vs. Email Marketing
- Text messages boast a 98% open rate, vs. email marketing’s 20%. [13]
- SMS click-through rates (CTR) are 9.18%, vs. email’s 2.5%. [14]
- Less than 3% of SMS messages are considered spam; nearly 85% of emails are. [14]
- The average person takes 90 seconds to respond to a text but 90 minutes to respond to an email. [14]
- Fewer companies run SMS marketing campaigns, making business texts more noticeable. Email is a saturated marketing channel; the average person receives 121 emails per day. [18]
Kickstart Your SMS Marketing With Textedly
Capitalizing on these mobile marketing stats begins with selecting the right software. Whether you’re new to text message marketing or want to take your mobile marketing strategy to the next level, Textedly offers the flexibility to accomplish your goal.
Textedly provides simple SMS business solutions that are easy to set up, so you can start messaging your customers today.
Get started with Textedly’s free trial to kickstart your SMS marketing campaign.

.png)